
In the Learning Lab segment of the Control Loop podcast that aired on Wednesday, September 21, 2022, I provided a handful of statistics. I thought it would be helpful to show some of those stats in graph form here, explain some of the numbers, and provide links to some of the sources so you could explore them yourself. For those who may not know Control Loop, Dragos produces this podcast in conjunction with CyberWire. You can find this podcast in your podcast app or at: thecyberwire.com/podcasts/control-loop
I focused the Learning Lab on electricity generation to discuss the incredible scale that industrial systems (and control loops) can achieve – through giant generation plants, millions of miles of wires, outlets in your walls, batteries that fit in your watch and pocket. AND, petroleum (oil, natural gas, etc.) has incredible scale too, considering offshore platforms, oil rigs, pipelines, and giant seagoing tankers. Perhaps it’s even bigger.
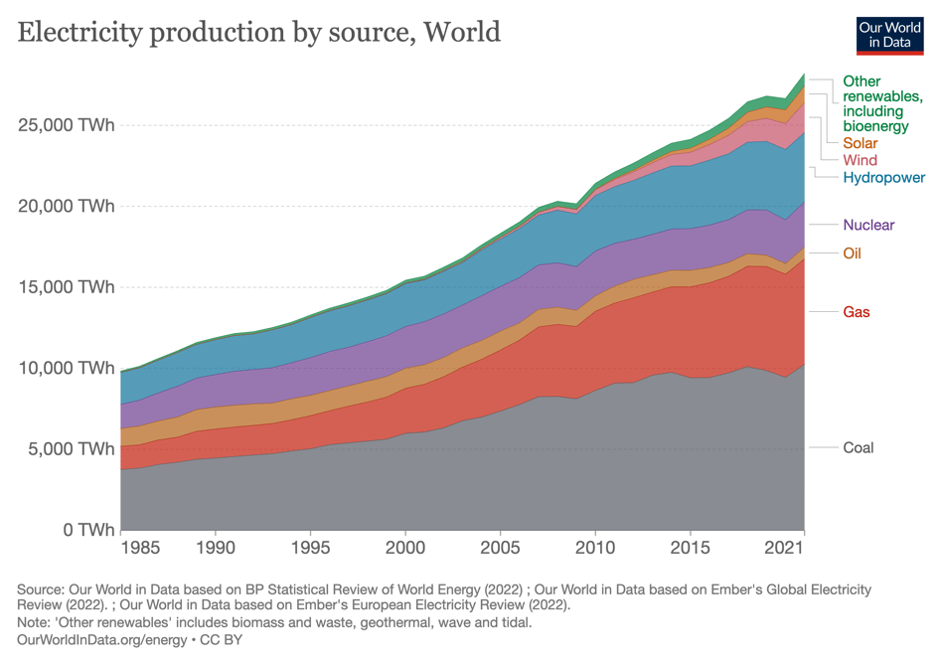
Most of the stats I cited described the generation of electricity. Coal, oil and gas, and other fuels are used in large quantity for that purpose. AND, they are used for other purposes as well, like heating homes, fueling automobiles, ships, and planes. So TOTAL consumption will be different than the status cited for electricity generation.
Some of the basics:
- Watt = One Joule per Second
- Kilowatt = 1,000 watts
- Megawatt = 1,000,000 watts
- Gigawatt = 1,000,000,000 watts
- Terawatt = 1,000,000,000,000 watts
Total Electricity Generation = 28,466 terawatt hours in 2021 = 28 trillion microwaves for an hour.
Who will save your soul = 238 Watts. If you figure out how this last stat is calculated, you have a questionable sense of humor.
Some of the statistics I presented in the lab were sourced from the Global Plants Database from the World Resource Institute, from Wikipedia, and from the back label of my microwave at home. Many of the stats were sourced from a fantastic tool from “Our World in Data”, a non-profit organization partnered with Oxford University. Their data navigation can be found at: www.OurWorldinData.org. A few of those stats are presented below.

Ready to put your insights into action?
Take the next steps and contact our team today.